Maybe It Isn’t a Bond Bubble After All

Bubble? What bubble?
Last week, I set out the case that bonds were in a bubble. Valuations were evidently extreme, they were backed by an exciting narrative and there was plenty of cheap money to support them. Many were buying solely on the calculation that they would be able to sell to someone else for an even higher price – the classic condition of a speculative frenzy, as set out many years ago by the MIT economist Charles Kindleberger in “Manias, Panics and Crashes.”
But there is an argument that even at negative yields, the bond market makes sense. We received some great supporting evidence for this with the latest flash purchasing manager indexes for manufacturing sectors around the globe. These early indicators of where the final numbers will settle – all set so that 50 markets the border between expansion and recession – suggest that the U.S. is converging downward toward the rest of the developed world, and that all the main manufacturing sectors are now below the 50 level:
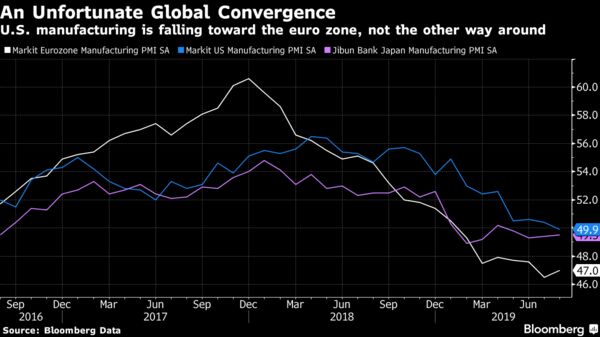
This isn’t the convergence that people were hoping for. Back in 2017, surprisingly strong growth in the euro zone raised hopes of a synchronized global recovery; now, it seems, the U.S. is dropping to Europe’s level.
This in itself helps to justify bond yields at their current levels, according to Albert Edwards of Societe Generale. Edwards is one of the most famous equity bears on the planet, and often attracts scorn for his persistent recommendations to stay out of the stock market. But he is also a very persistent bond bull, and in this he has been right. This week he attacked the notion that bonds are in a bubble. To start off, he suggests that the move in yields is no more than would be expected given sagging global PMIs:
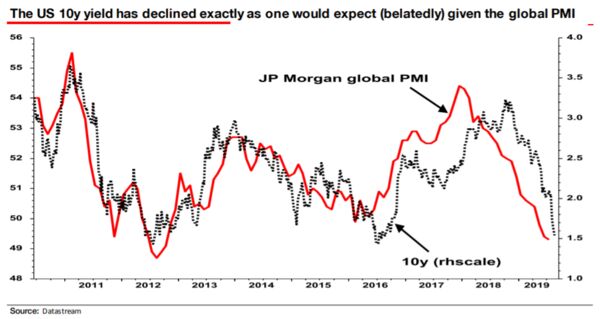
Reasonably enough, this implies that Treasury yields should track global growth, rather than specifically American growth. Amplifying his argument, Albert suggests that yields should be low because even some of the economic data that appear to show strength are in fact beginning to flash warning signs. The latest U.S. non-farm payrolls data came as a reassurance, but he homed in on the length of the work week. When companies see the need to cut back, they often start by trying to cut back the number of hours worked, before resorting to more painful measures. That logic implies that we should regard the recent decline in hours worked as a signal of trouble ahead:
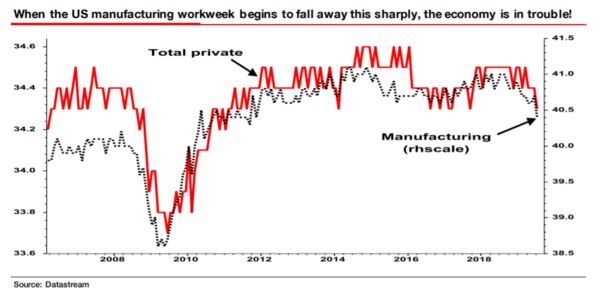
While Edwards’ point is well taken, I think it may be a little overstated. The work week has declined recently, but remains at levels that it has touched a few times before during the post-crisis decade. Still, it’s fair to say that another decline would begin to suggest strongly that this is more than another mid-cycle deceleration.
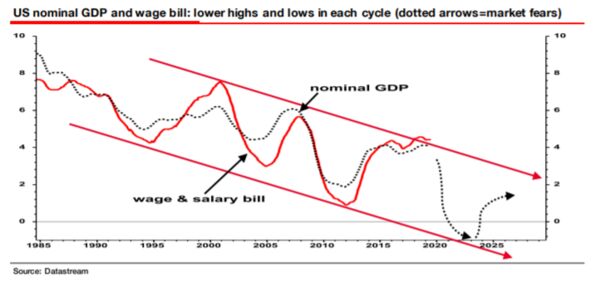
Edwards’ long-term thesis is called the “Ice Age.” He believes that interest rates will grind lower as the world economy runs out of puff, with each low in the cycle lower than the previous one – all very similar to Japan. There, this entailed a steady drop in bond yields (which has happened in the west), and a stricken equity market (which has absolutely not happened). But by his argument, we merely need to wait for the next recession for the denouement. This is a classic Ice Age chart, which he produced this week:
This is how he explains his chart:
The last few cycles have seen a sequence of lower lows and highs for nominal quantities (along with bond yield and Fed Funds). I have used a 4-year moving average and have added where I think we may be heading in the next downturn and rebound – and more importantly where I think the market is now thinking where we are heading. That is why this is not a bond bubble. It is the next phase of The Ice Age. And it is here.
Those who are used to poking fun at the way his bearish prognosis for equities continues not to come true should bear in mind, a) that equities are currently trading on the assumption that bond yields will remain low, which requires a negative economic outlook like this, and b) that he has at least been right about bonds.
He adds one final defense against the charge of the bubble, which is from technical analysis. There has been a steady downward trend in 10-year Treasury yields ever since Paul Volcker vanquished inflation in the early 1980s. That trend appeared to break last year, bur yields are now back within their trading range. Meanwhile, the patterns for German bunds is just as strong – and even the current negative yields leaves the market comfortably within its long-term trading range. Here is a chart as I tried to replicate it on Bloomberg:
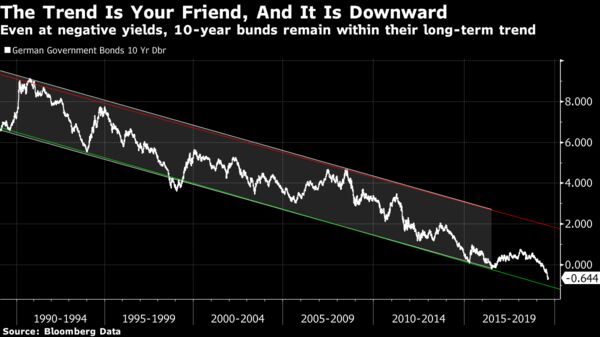
Ultimately, I suspect everything depends on the power of the narrative. If Japanification is the fate of the western world, then something like the Edwards Ice Age thesis is going to come true. And that, in turn, would imply that this isn’t a bubble that can be burst.
If it is a bubble …
Following on from this, perhaps the most powerful question in determining whether this is a bubble is: What could burst it? It’s hard to think of much.
There are a few obvious answers, but they are deeply implausible. A clear-cut agreement that brought a definitive end to the trade conflict and ushered in a new and durable basis for the U.S.-Chinese economic relationship would dispel the atmosphere of pessimism very rapidly. But that isn’t likely. Alternatively, a resurgence of inflation in the U.S., or particularly the euro zone – making it clear that central banks couldn’t possibly cut rates as currently expected – would do the trick. That also seems unlikely.
Markets can generate their own catalysts, or moments when the absurdity of valuations becomes evident. Dutch Tulipmania, arguably the most famous investment craze of them all, came to a swift halt after an auction failed. It only needed one auction in which nobody felt like offering the reserve price for some tulip bulbs, and then the news swept through the country and the entire market collapsed.
German bunds had a potential “moment of truth” earlier this week when 30-year bunds were auctioned at a negative yield, and less than half of them were bought by investors. The narrative: “At last everyone confronts the absurdity of buying a bond for a guaranteed capital loss, and the mania is over.” Except, the market’s reaction to news of the auction was muted, and yields have since fallen again.
Then there is the possibility of a central bank surprise. If the Fed, or any of its counterparts, disappointed investors by drawing a line in the sand and refusing to cut further, it could cause an ungodly mess. There are certainly plenty of officials and decision makers at both the Fed and the ECB who would love to hold out against yet more monetary easing and refuse to cut rates.
The problem here is that this would, in fact, cause an ungodly mess. Central banks are understandably very nervous to shock the markets in a hawkish direction, precisely because a sudden rise in yields, exacerbated by low liquidity, could easily trigger the next financial crisis. In any case, it seems only a total horror show from the Fed could burst the bubble. The fall in yields has happened even as Fed officials have poked their heads above the parapet to talk down expectations of a 50 basis-point rate cut next month. Very little chance of this happening is now written into futures prices – and yet Treasury yields remain very low. Fed Chair Jerome Powell has an excruciating job talking down expectations without causing an accident when he speaks at Jackson Hole on Friday, in what is likely to be this week’s major economic set-piece event, but he will certainly try to avoid an accident.
A murkier catalyst, if it can be called one, might come from an end to the technical factors that have driven this latest leg down in yields. Bonds have seen big flows from insurers and pension funds seeking to match their liabilities (or, in other words, needing to buy bonds before they become even more expensive). Weaker inflows of money could lead to the bubble slowly losing air.
But broadly, these outcomes seem unlikely. Most of them would be positive, as they would imply a stronger economy than many now believe. But thanks to the bond bubble, we would then have to suffer the ripple effects from sharp rises in yields, which would include lower equity prices. The Edwards non-bubble world, of lower stock prices but continued high bond prices, seems preferable.
Big, bad Mo.
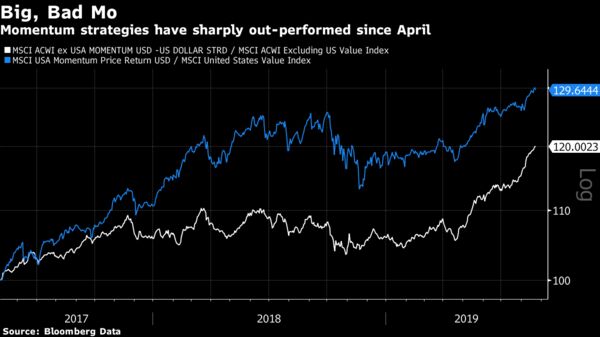
Big, bad Mo has had a great month. The momentum factor – the tendency for winning stocks to keep winning and losing stocks to keep losing – is one of the best documented factors in markets. Springing from deep-seated human nature, it tends to work. Over the last decade, grabbing the coattails of the winners has delivered far better results than the rival strategy of buying cheap stocks (known as the value factor). But that long-established trend has gone into overdrive since May:
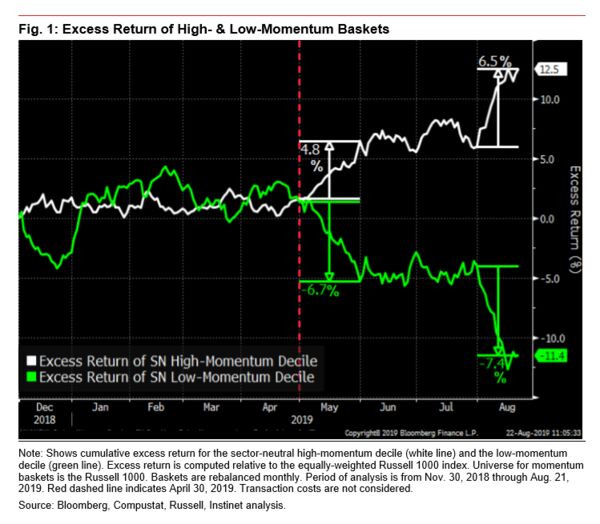
There is more to it than this, however. A fascinating note from Nomura Instinet’s quantitative strategist Joseph Mezrich points out that this is one of the very rare occasions when the winners are winning and the losers are losing to an almost perfectly symmetrical extent.
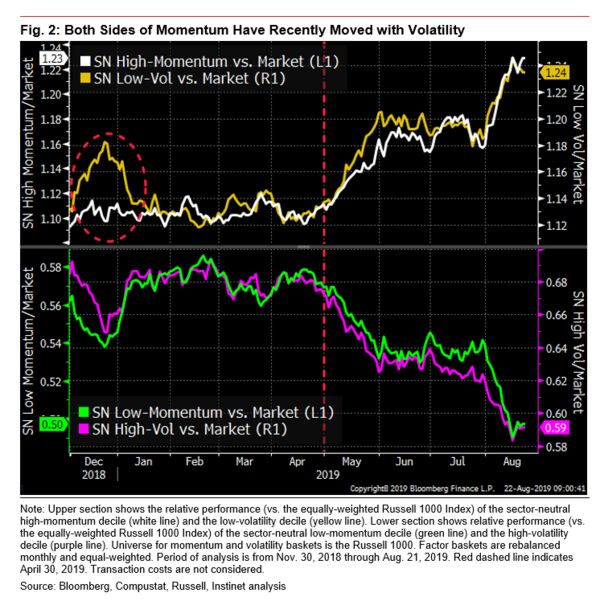
This is a very unusual state of affairs. If there is an explanation, it probably lies in a big change in the way that investors are perceiving risk. Mezrich does the groundwork by comparing positive and negative momentum stocks with stocks that have been sorted according to their volatility. Low-volatility stocks, which don’t move that much during periods of market upheaval, are for obvious reasons very popular amid periods of high risk and volatility. High-volatility stocks are popular when things are going well, as they are essentially a leveraged bet on the market.
Normally, returns on momentum aren’t particularly related to risk. But as Mezrich charts, at this point these factors seem to be in almost perfect alignment. In May and again in August, investors pushed up low-volatility and high-momentum stocks, while getting out of low-momentum and high-volatility stocks. So this is a period where an increase in risk has prompted a move into momentum.
Put differently, people are scared, and in their fear the stocks that normally seem safest in times of risk have gained momentum. Or as Mezrich puts it in his piece:
Since the tech bubble, in only 4 months (of more than 200 observations) have we seen an extreme momentum “double win”: September 2002, June 2008, May 2019, and August 2019 (month to date). The momentum factor (long-short) has seen outsized returns from time to time, but in the majority of those cases, the return was concentrated in one side of the factor. In the 4 months mentioned above, when both sides of momentum exhibited large excess returns, the long side of momentum loaded up on low-volatility stocks. In other words, during these 4 months, the momentum factor (and particularly the long side, which is the focus of various ETFs) became synonymous with a bias away from highly risky stocks. When both the long and short baskets of momentum become connected to volatility, and when the market expresses a strong risk-off view, outsized (positive) return in momentum can result.
As Mezrich documents, this has only happened twice before in the last two decades. The first was in September 2002, when the market was hitting bottom after the WorldCom and Enron scandals and starting a rally that would get going in earnest after the invasion of Iraq the following year. The second was in June 2008, when the “Chicken Little” fear of a financial implosion was gripping many in the market following the rescue of Bear Stearns Cos. earlier that spring.
The returns for the market following these two episodes could scarcely be more different. It gained 22% in the 12 months after September 2002, and lost 28% in the 12 months after June 2008.
But let’s look at what was going on in both cases. In September 2002, the drumbeat that led to war in Iraq was beginning. People were scared by this. As it turned out, the invasion appeared to be far less damaging to the world economy than many had feared. (People would live to review that judgment, of course, but in late 2003 there was still overwhelming relief that the invasion of Iraq had passed off far more smoothly than many had feared.)
In June 2008, there was reason to fear a true, epic financial collapse – and something very close to the market’s worst fears actually happened, and so the market fell.
What the performance of Big Mo tells us, then, is that something is afoot that frightens people as much as the prospect of war with Iraq did in 2002, or of the prospect of a financial meltdown in 2008. I think we can at least guess that what has the market spooked this time is the trade war. We’ll have to wait for the outcome to see what the ultimate consequences will be for markets and the economy.
This column does not necessarily reflect the opinion of the editorial board or Bloomberg LP and its owners.
To contact the editor responsible for this story:
Beth Williams at bewilliams@bloomberg.net